Structural reliability analysis
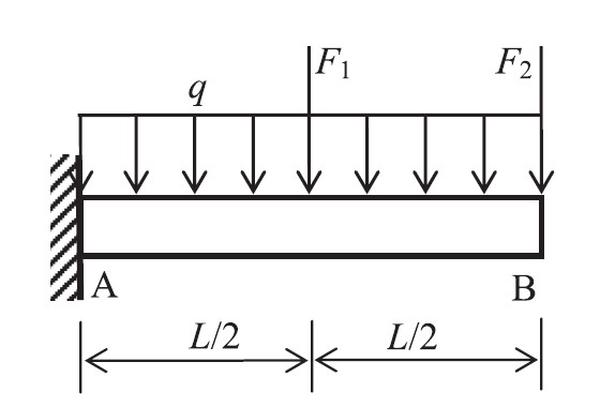 Reliability analysis of cantilever beam
\begin{equation} \small
Y = f \left ( \boldsymbol{X} \right )
\tag{1}
\end{equation}
The probability of failure $ P_{f} $ is defined as the probability of structural response being in a domain of unacceptable operation, such as response exceeding a critical threshold, $ y_{c} $, and it is typically defined in terms of a limit state function
\begin{equation} \small g \left ( \boldsymbol{X} \right ) = y_{c} - f \left ( \boldsymbol{X} \right ) \quad {\rm such\ that}\ P_{f} = {\rm Pr}\left [ g \left ( \boldsymbol{X} \right ) \leq 0 \right ] \tag{2} \end{equation}
There are a number of reliability analysis method, like Monte Carlo simulation (MCS)[1],first-order reliability method (FORM)[2],second-order reliability method[3] and the moment methods[4]. One of the main challenges is to balance the accuracy and efficiency of the reliability analysis, that is
- minimize the function evaluations
- find the most appropriate probability distribution or explicit approximation of the implicit limt state function
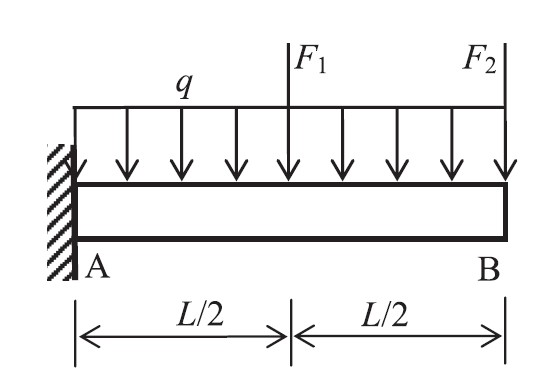
and the results obtained by MCS, proposed method, RSM with only quadratic term (QP) and complete quadratic term (CQP) are shown in Table 1,where $ \beta,\ k_final,\ and\ N $ is the Hasofer-Lind Rackwitz-Fiessler(HL-RF) reliability index, the number of iterations and function evaluations. It can be observed that the proposed method is able to obtain accurate result with less function evaluations
| Method | $ k_{final} $ | $ N $ | $ \beta $ | Error(%) |
| MCS | -- | $ 10^7 $ | 2.725 | -- |
| RSM with QP | 3 | 23 | 2.710 | 0.6 |
| RSM with CQP | 3 | 39 | 2.619 | 3.9 |
| proposed method | 3 | 25 | 2.710 | 0.6 |
However, the method only consider component reliability analysis within linear elasticity case. In the future I would like to dig more about structural reliability analysis in system or dynamic case.
Reference
[1] Rubinstein RY (1981) Simulation and the Monte Carlo method.Wiley,New York
[2] Hohenbichler M, Rackwitz R (1982) First-order concepts in system reliability. Structural safety 1(3): 177-188.
[3] Breitung K (1984) Asymptotic approximations for multinormal integrals. Journal of Engineering Mechanics 110(3): 357-366.
[4] Xi Z, Hu C, Youn BD (2012) A comparative study of probability estimation methods for reliability analysis. Struct Multidiscip Optim 45:33–52.
[5] Fan W, Shen W, Zhang Q, et al. A new response surface method based on the adaptive bivariate cut-HDMR. Engineering Computations.
[6] Fan W, Wei J, Ang AHS, Li Z (2016) Adaptive estimation of statistical moments of the responses of random systems. Probabilistic Eng Mech 43:50–67.
[7] Chowdhury R, Rao BN (2009) Hybrid High Dimensional Model Representation for reliability analysis. Computer Methods in Applied Mechanics & Engineering 198(5 :753-765.